

Series (III): T20 cricket to diversify bankroll deployment
Part 3: Individual batting performance

In the last article, we took a look at team level data in T20 cricket to help us understand the overall shape of the game. Today, we’ll get more granular and look at how individual player analysis helps us understand where runs come from. . From there, we’ll look at how we start converting raw individual statistics into metrics that might have some predictive power when fed into a model of some kind to predict cricket outcomes. We’ll use baseball hitters as our frame of reference, similar to last time, to anchor our understanding so we can draw on as many familiar concepts as possible.
A batter’s job in cricket seems broadly similar to a batter’s job in baseball: hit a ball in service of advancing the offense. In many ways, cricket seems easier to analyze a batter’s contribution to the offense: batters in cricket seem like they would always have the same job in T20 cricket (score as many runs as possible). A batter’s job in baseball ,by comparison, isn’t always to try and score as many runs as you can by yourself (sacrifice flies/bunts exist for that exact reason).
The trickiest part we have to account for in cricket is the dramatically higher levels of variance in a batter’s contribution due to the nature of the offense. In baseball, batters’ effectiveness is typically measured in terms of their contribution per plate appearance. Metrics like batting average, on-base percentage, and slugging percentage all use plate appearances (or at-bats, more or less) as their denominator, and plate appearances are a pretty stable quantity from game to game. The rules of baseball are naturally conducive to these metrics: a batter’s contribution to the offense is a result of their consumption of each plate appearance, and the number of pitches they face to get that consumption is independent of the outcome. In other words, it doesn’t matter if it took you 2 pitches or 12 pitches to get a hit, the end result is the exact same.
Cricket batters are always contributing to a team’s offense as long as they’re not out yet. If you make contact and you don’t get out, the default assumption should be at least one run gets scored due to the relative ease of scoring in cricket. This is why strike rate, or runs per delivery, is accepted as a standard metric for evaluating players’ offensive capabilities. This doesn’t, however, seem to tell the whole picture; a player’s total contribution also depends on their ability to stay batting and not get out. To give an extreme example: a batter who always hit a six (the equivalent of a home run) on the first ball and immediately got out on the second ball would have an incredibly high strike rate, but their longevity would be so small, their overall offensive contribution would be far less than someone who could stay in and generate more runs. To further go against myself, as we saw in the last article, the importance of longevity in T20 cricket is notably less than traditional cricket, since a bowling team only takes all 10 wickets about 16% of the time. Ao a batter having potentially shorter longevity wouldn’t be nearly as impactful as a format where a batting side is guaranteed at least 10 full wickets. Ideally, a predictive model will validate this observation, but we have to take our baby steps first, and that involves coming up with a list of metrics that do a good job of encapsulating a batter’s offensive production.
We’ll separate out these concepts in two analyses: looking at batters’ abilities to not get out, aka their longevity, and batters’ abilities to produce runs, aka their contribution to offense.
Survivability
Just like last time, we’ll start our understanding of cricket batters by spinning up some distributions. The first thing we’ll look at is what the distribution looks like for how many deliveries each batter receives per wicket before they get out:
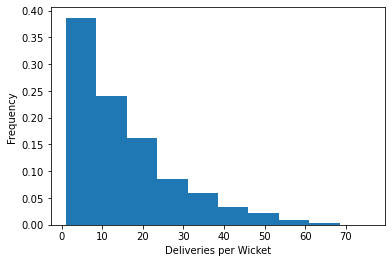
This looks like a pretty standard survival curve, which matches our intuition of how cricket batting works: you’re constantly batting to stay alive, and as long as you’re in, you’re contributing to the offense. The steepness of the survival curve is kind of concerning: it’s pretty far clustered to the left, with 37% of wickets having 10 deliveries or less. This doesn’t give us a huge sample size to work with for determining a batter’s strike rate in a given match, so we’ll have to be very wary of the effects of low sample size. For now though, we’ll proceed without strictly accounting for it.
A batter can be out by 5 commonly occurring ways, we’ll list them here along with their rough equivalent in baseball:
A fielder catches a ball after the batter hits it. Nearly identical to how it works in baseball, with the difference that it’s generally harder to catch a cricket ball, so fielding isn’t nearly as routine in cricket.
The bowler hits the wicket with a delivery. Most similar to a strikeout, but not nearly as similar as a caught ball.
A run out, where a fielder throws the ball to a wicket the batter is attempting to run towards. Closest to a baserunner being thrown out on the base paths.
A “leg before wicket”, or LBW, where a batter illegally blocks a delivery with their leg to prevent it potentially hitting the wickets. Roughly equivalent to batter’s interference, except it happens far more often than in baseball.
Stumping, a special case of a run out, where if no part of the batter’s body or held bat is grounded behind the crease (roughly equivalent to the batter’s box) when the wickets are hit with the ball by the wicket keeper (a special defensive catcher), they’re called out. This doesn’t have a great baseball equivalent: it’s roughly as if a batter swung so hard that their bat touched the ground outside the batter’s box, and that means you’re automatically out.
There are other ways players can get called out, but they’re infrequent enough that we’ll just label them as “other” for now.
Here’s the overall frequency at which the outs occur over all of T20 cricket to establish a baseline expectation of how and when batters get called out:
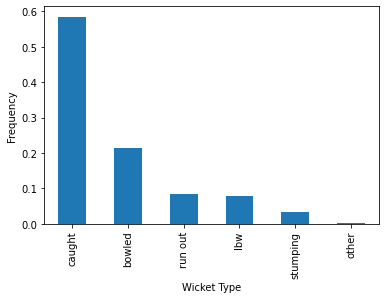
Caught balls account for 58% of all T20 cricket outs overall, overwhelming the most common way to get out. Ideally, we would love to create these percentages for individual players as well, because we could hypothesize that different players have different percentages in each of these categories, which might say something about their survivability. If, for example, we later find out that something like LBW is more of a fluky out due to lots of extrinsic factors (batter technique errors that aren’t typically repeatable, an aggressive umpire that made too harsh a judgment call etc) and we see that a player has had a disproportionate amount of LBW outs in their past performances, we can surmise their survivability might look artificially low due to bad luck, and that it is not predictive of future survivability.
As an illustration, we can compile statistics on individual batters, and look at the distributions of those stats to get an idea of the variability of stats like the above percentages. Here, for example, is the distribution of batters’ caught ball percentages of their overall outs to see how much variation there is around that 58%:
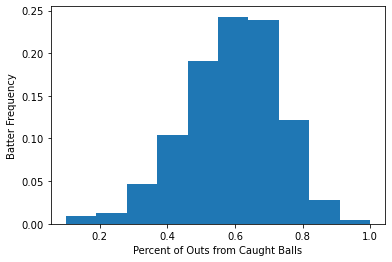
While the distribution still centers around that 58% average, there’s still a decent amount of variability, indicating that not all batters have 58% of their outs from caught balls on average. A natural next step to refine our understanding will be to eventually explore some of the stability and predictive power of these stats down the road. In other words, if a batter’s caught ball percentage is higher than 58%, we will eventually want to know if we can expect their caught ball percentage to also be higher than 58% in the future.
Offensive Production
Let’s also take a look at the distribution of runs per delivery without any kind of adjustments:
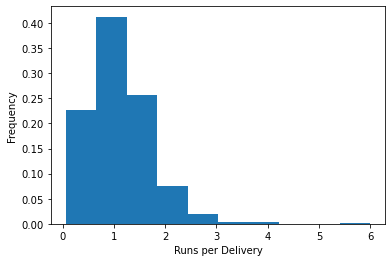
This is what happens when you explore data without accounting for outliers: all it takes is one batter to score six runs on a single delivery and get out afterwards to skew your graph and make it harder to get a sense of the more typical distribution. (This could prompt a much longer discussion of managing outliers in your data, but that’s a topic in itself). Here’s what that distribution looks like for batters who face at least 8 deliveries to help tamp down some of the visual effects of those outliers:
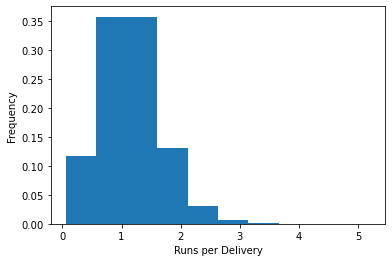
Still have a little bit of outlier management to do, but it’s not as bad. We can at least see a little clearer that the average runs per ball is around 1.15, which sets some sort of baseline expectation of what overall offensive production looks like. Now, we can get a little more granular with the runs themselves to describe a little more about where offense comes from.
Baseball hitters have distinct styles: the classic oversimplified comparison being speedy contact hitters who get on base a lot and can run the bases fast, versus slow power hitters who may not run fast, but can hit for lots of extra bases. Distinguishing between these types of offensive production is not just useful for descriptive purposes, it’s also very helpful for predictive purposes. The rise of defense-independent pitching statistics in the early sabermetrics days helped separate a batter’s outcomes from what the batter could control versus what the defense could control, which helped separate signal from noise in predicting a batter’s future outcomes. In cricket, there are also runs that come predominantly from hitting power: a batter scores six runs for balls that clear the fence (aka a home run), and four runs for balls that reach the boundary of the playing field (roughly equivalent to a ground rule double). We can see the value of separating out how much a player’s runs come from sixes: the defense has nothing to do with that type of offensive production, so isolating power as a statistic will likely have some predictive value. On the other hand, if we get a model that determines how important power is in boosting a team’s chance to win, I would not be surprised if it’s less important than in baseball. One of the secondary benefits of power hitters in baseball is their ability to bring baserunners home, but in cricket, baserunners have less of an impact, so we shouldn’t expect the same importance level as in baseball.
As always, we at least want to see what level of importance fours and sixes generally play in a batter’s offensive production. Here are the distributions of what percent of total runs are accounted for by fours and sixes on a per batter basis:
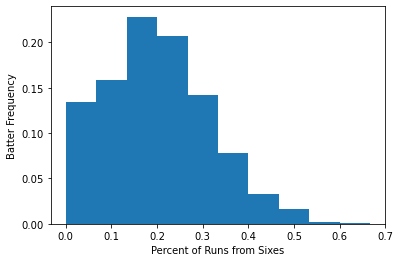
In general, fours account for 31% of batters’ runs on average, and sixes account for 20%. Combined, they’re just over half of players’ runs. Eventually, we would like to know if these percentages have some DIPS-like predictive qualities, aka if a player has higher than 20% of runs from sixes over some time period, if we can expect future production to be higher than 20% as well.
At the end of this, we have a couple new metrics: out type percentages, deliveries per wicket, runs per delivery, fours percentage, and sixes percentage, that we can at least generate and eventually feed into a model of some kind. It has yet to be seen if any of these metrics are especially predictive, but we at least have a way to break down offensive production to understand how and where it comes from. Next article, we’ll do the same for bowlers.