

Series (IV): T20 cricket to diversify bankroll deployment
Part 4: Individual bowling performance

In the last article, we looked at batting stats in cricket and came up with some elementary metrics that we hope will eventually have some predictive power. Today, we’ll take a look at the other side: statistics for bowlers. Like last time, draw on our understanding of analysis for baseball pitchers, find similarities that do and do not apply, and see if we can come up with some interesting metrics for cricket bowlers that will help us in our eventual cricket model.
Hitting and pitching stats in baseball are essentially two sides of the same coin: whatever a batter produces on offense, the pitcher allows on defense. The analysis and understanding of where offense comes from for batters can essentially be inverted when looking at pitchers: K/9 and BB/9 rates are per inning, hitter walk rates and strikeout rates are per plate appearance.
If we assume some expected number of plate appearances per inning within reason and functionally make plate appearances equivalent to innings for rate calculation purposes, the statistics become functionally equivalent. There are other similar inversions: ISO and slugging percentage for batters tells a similar story to ground ball rate for pitchers (power hitting produced versus power hitting allowed).
With that in mind, our starting metric for analyzing bowler performance should probably be the same as one of our base hitter metrics: runs per delivery. For bowlers, we’ll specifically look at runs per delivery allowed, since bowlers are trying to minimize this metric, and batters are trying to maximize this metric. There shouldn’t be too many surprises compared to hitters: after all, the average runs per delivery scored across all of cricket has to be equal to the average runs per delivery allowed. But let’s see what the distribution looks like for runs per delivery for a given match for each bowler:
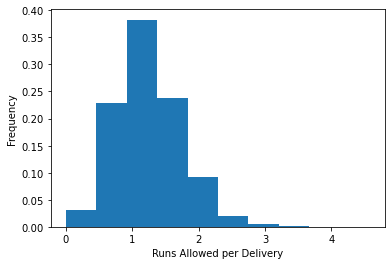
Remarkably similar to the same distribution for batter runs per delivery. For reference, we’ll also look up fours and sixes allowed per delivery:
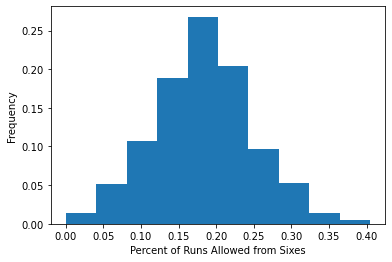
Again, pretty similar to the distribution from batters. If all we did was create mirror images of runs scored and allowed per delivery and sliced them in a more granular way we would be in pretty good shape. There are, however, some other additional wrinkles from bowling stats we need to toss in to help us shape our evaluation of bowling performance.
Defense Independent Bowling Stats
One additional metric tracked for bowlers is dots, or legal deliveries where no runs are scored. Dots are obviously good for bowlers, so a metric like dots per delivery seems like a worthwhile metric to construct as well. You might be wondering why bother calculating this as a separate metric when it’s largely overlapping with our workhorse runs per delivery allowed metric. If a bowler is good at not allowing runs, that should be reflected in a low runs per delivery allowed. While this is true, including dots gives us a key metric that has a critical advantage: fielding is not remotely involved.
We mentioned defense independent pitching statistics in the last article, and how they are valuable because they have a cleaner signal of attribution. When a ball is hit in cricket, once it’s in the field of play and it’s not a four or a six, how many runs it produces is a combination of how good or bad a delivery it was from the bowler and how good the fielders and field placement is at minimizing the runs. Attributing blame between the two is very hard for balls in play, and has only been made possible by more granular data like PitchFX and HitFX which track velocity vectors of balls in play to help isolate skills like fielding.
We’re probably not going to get BowlFX any time soon, so we’ll have to rely on metrics where we know fielding has no influence to identify repeatable and predictable bowler attributes. Dots are a perfect metric: they’re roughly equivalent to strikeouts in baseball, which the defense also has nothing to do with (outside of catcher framing, which is a niche subject we can basically ignore for now).
A practical application of something like dots per delivery is observing that if a player’s dots per delivery has been high for a bowler the last couple of games but their runs per delivery is also high, we would expect that some of those runs are due to factors outside the bowler’s control: maybe their fielders dropped a disproportionate number of balls, which is essentially variance.
Similarly, we can also measure mistakes the bowler makes with stats such as wides and no balls. Wides are similar to wild pitches: a delivery that the umpire decides the batter would have no reasonable chance at hitting. Unlike wild pitches, wides result in automatic extras assigned to the batting team, so the consequences are much higher. No balls are deliveries where a bowler’s technique is ruled illegal: roughly similar to a balk in baseball. No balls are slightly more complicated in that illegal actions by fielders can also result in a no ball, and even if the fielder is responsible, the no ball is credited against the bowler. Wides and no balls per delivery seem like reasonable metrics to include in our models as well: not only do they impact the final score, but they could also be useful proxies for other harder to measure attributes of bowlers. If a bowler has a high dot rate, they might have generally harder to hit balls and produce poor contact from hitters more often.
Now that we have an initial list of aggregated metrics, we can start calculating them for eventual use in a model. We’ll outline our first modeling approach in our next article.